Renewable Energies Background Document
Invest in renewable energy for healthy, green and just communities
Over the coming years, the Canadian government will be investing in programs and policies to kick start our economy and get people back to work after the COVID-19 pandemic. These investments provide the opportunity to rebuild our economy and communities to address the growing threat of climate change, to reduce the health inequities that have been highlighted by the COVID-19 pandemic, and to make our communities healthier and more resilient.
To create a more sustainable future, we must significantly reduce our reliance on fossil fuels because their extraction and use releases greenhouse gases (GHGs) that cause the global warming that is disrupting ecosystems around the world. The transition away from fossil fuels will require a fundamental transformation in our society. Where we have used coal, oil, natural gas, gasoline and diesel to power our factories, generate electricity, heat our homes, and fuel our vehicles, we will need to use electricity in the future. To meet a growing demand for electricity, we will need to expand our power grid and make it more reliable and resilient, while ensuring that it emits no GHGs and produces as little air and water pollution as possible.
Canada’s electricity sector
Canada is fortunate to have a relatively low-carbon electricity sector. In 2018, 82% of Canada’s electricity (647.7 million Megawatt-hours (MWh))1 was generated from carbon-free sources that emit no GHGs:
- 61% from hydro;
- 15% from nuclear plants;
- 5% from wind; and
- less than 1% from solar and geothermal.
The other 18% was generated from coal/coke (8%), natural gas (9%) and biomass (1%).2
Biomass, such as wood pellets, is considered a renewable resource only if its rate of consumption does not exceed its rate of regeneration.3 Unlike the renewable energies mentioned above, when used to generate electricity, biomass does release air pollutants that can be associated with health concerns.4
Over the last two decades, GHG emissions from Canada’s electricity sector dropped by 43% due mostly to the phase out of five coal-fired power plants in Ontario. This phase-out reduced GHGs by 41.4 million tonnes (Mt) between 2000 and 2017.5 Despite this improvement, the electricity sector remains a significant source of GHG emissions, responsible for about 9% (about 64 Mt) of Canada’s total GHG emissions in 2018 (729 Mt).6 Most of those emissions came from utility-scaled coal- and natural gas-fired power plants.
In December 2018, Canada announced regulations to phase-out traditional coal-fired power plants by 2030 as well as GHG regulations for natural gas-fired power plants. These regulations aim to ensure that, by 2030, 90% of the electricity generated in Canada will be from sources that do not emit GHGs.7
Provinces with high emitting electricity sectors
The four provinces that contribute most to GHG emissions from Canada’s electricity sector are Alberta, Saskatchewan, Nova Scotia and New Brunswick.
Alberta was responsible for 60% of the GHGs emitted by Canada’s electricity sector (44.3 Mt) while generating only about 13% of Canada’s electricity. 92% of Alberta’s electricity was produced with fossil fuels (43% from coal, 49% from natural gas). The remaining 8% was produced from renewables, such as wind, hydro, and biomass.
Alberta has the largest number of coal-fired power plants with a total capacity of 5,555 Megawatts (MW). These plants will be phased out by 2030 under Alberta’s Climate Change legislation. Alberta is now the third highest producer of wind power with 1,467 MW.8
Saskatchewan was responsible for 21% of the GHGs emitted by Canada’s electricity sector (15.5 Mt) while generating about 4% of Canada’s electricity. 83% of Saskatchewan’s electricity was generated with fossil fuels (43% from natural gas, 40% from coal). The remaining 17% was generated in hydroelectric plants.
Southern Saskatchewan has some of the highest potential in the country for solar photovoltaic and wind energy. The first utility-scale solar project (10 MW) is expected to come online in 2021. The province has six wind farms with a collective capacity of 241 MW.9
Nova Scotia was responsible for about 9% of the GHGs emitted by Canada’s electricity sector (6.5 Mt) while generating approximately 1% of the electricity. Fossil fuels were used to generate 76% of Nova Scotia’s electricity (63% from coal and coke, 9% from natural gas, 4% from petroleum). Renewables were used to generate 24% of Nova Scotia’s electricity (12% from wind, 9% from water/tidal/geothermal sources, 3% from biomass).10
New Brunswick was responsible for 5% of the GHGs emitted by the Canada’s electricity sector (3.6 Mt) while generating approximately 2% of its electricity. Approximately 67% of New Brunswick’s electricity was generated from carbon-free sources (39% from nuclear energy, 21% from hydroelectricity, 7% from wind) while about 30% was generated from fossil fuels (natural gas, coal, heavy fuel oil and diesel) and 3% from biomass.11
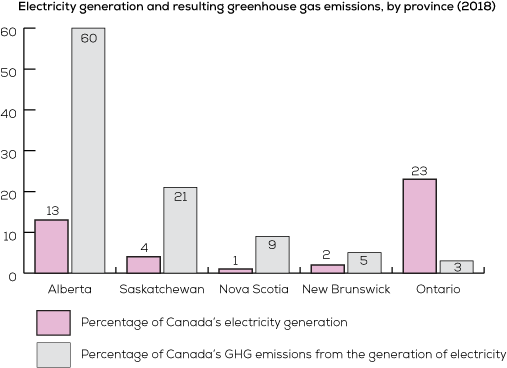
Ontario was responsible for 3% of the GHGs emitted by Canada’s electricity sector (2.0 Mt) in 2018 while generating approximately 23% of the country’s electricity. About 95% was generated from carbon-free sources (60% from nuclear, 26% from hydroelectricity, 7% from wind, 2% from solar). The remainder was produced with natural gas and biomass. Ontario is Canada’s largest producer of wind and solar power with 5,061 MW of wind capacity and about 2,871 MW of solar capacity.12
Between 2005 and 2014, GHGs emissions from Ontario’s electricity sector decreased by 41 Mt because of the phase-out of five coal-fired power plants. Unfortunately, emissions are expected to increase by 15 Mt by 2040 because of plans to increase the use of natural gas to provide baseload demand while Ontario’s nuclear plants are taken offline for refurbishment.13 This would be a significant increase in Ontario’s GHG emissions at a time when GHG emissions need to be reduced dramatically.
All other provinces and territories are responsible for less than 2% each of the GHGs emitted by Canada’s electricity sector because they rely almost entirely on non-emitting sources of electricity or generate very small amounts of electricity.14
Renewable energies are a practical and affordable option for Canada
Over the last decade, renewable energy has become a practical and affordable option for Canada. A 2019 modelling study in Alberta found that it would cost less to generate electricity using a clean energy portfolio than with new natural gas-fired power plants.15 Clean energy portfolios consist of non-GHG-emitting energy sources such as wind and solar power that are supported by battery storage, policies that provide flexibility with energy demand, and measures that increase energy efficiency (such as building retrofits).
The Alberta modelling study compared a clean energy portfolio against a combined-cycle natural gas-fired power plant to provide electricity for baseload demand and against a simple-cycle gas plant to provide electricity for peaks in demand and found that the clean energy portfolio provides the same level of service as the natural gas-fired power plants at a much lower cost. The study found that it would cost:
- $48 per MWh with the clean energy portfolio and $57 with the combined-cycle gas plant to provide baseload electricity; and
- $66 per MWh with the clean energy portfolio and $90 with the simple-cycle gas plant to provide electricity for peaks in demand.16
These modelling results are consistent with an international cost analysis that found that even unsubsidized utility-scale solar photovoltaics ($30-38/MWh) and on-shore wind power ($26-54/MWh) were cost competitive with existing coal plants ($34-48/MWh), combined-cycle natural gas plants ($23-32/MWh) and nuclear plants ($25-32/MWh) that have been fully depreciated. With subsidies provided to solar and wind, they become much more competitive at $24-32/MWh and $9-43/MWh, respectively.17
Renewable energies reduce air pollution
Non-emitting renewable energies such as solar and wind power can produce significant health benefits for Canadians by reducing air pollution. Despite significant improvements in air quality in some regions of the country gained over the last few decades, air pollution in Canada continues to be responsible for a significant burden of illness. Approximately 14,600 premature deaths each year in Canada from heart disease, strokes, lung cancer and chronic obstructive pulmonary disease are attributed to air pollution.18
Coal-fired power plants emit significant quantities of the common air pollutants, sulphur dioxide (SO2), nitric oxide (NO) and nitrogen dioxide (NO2). Short- and long-term exposure to NO2 and SO2 is associated with increases in respiratory ailments, chronic diseases and premature deaths, while exposure to SO2 is linked to cardiovascular ailments.19 There is also some evidence that low-level exposure to SO2 by pregnant women may increase adverse reproductive outcomes such as congenital heart defects and preterm delivery.20
NO and NO2 emissions contribute to the formation of ground-level ozone, the air pollutant that triggers most of the smog alerts in Canada. Ground-level ozone irritates the lungs, aggravates respiratory conditions such as asthma, and increases emergency room visits, hospital admissions, and premature deaths from cardio-respiratory impacts.
In addition, SO2, NO and NO2 emissions react with other elements in the air to form fine particulate matter (PM2.5), the air pollutant most clearly and consistently associated with increased rates of chronic heart and lung diseases and premature deaths from heart and lung conditions. PM2.5 has also been associated with adverse reproductive outcomes, neurodevelopmental and cognitive deficits, and increased rates of diabetes.21 Several studies conducted in 2020 also suggest that long-term exposure to PM2.5 may increase death rates from COVID-19,22 with one study estimating that air pollution could be contributing to 15% of all deaths from COVID-19 around the world.23
While air pollution is harmful to everyone, it presents a greater risk for some. For example, young children, older people, pregnant woman, and those with pre-existing health conditions such as asthma, are more sensitive to the adverse effects of air pollution.24 In addition, a number of groups within Canada – such as lower-income populations, newcomers, racial minorities, Indigenous Peoples – are more vulnerable to air pollution because they already experience higher rates of illness, chronic diseases and premature deaths because of social disadvantages.25 These sensitive and disadvantaged populations would benefit most from the elimination of air pollution from coal plants.
The Pembina Institute estimated that in 2014, the 14 coal-fired plants operating in four provinces in Canada were responsible for approximately 160 premature deaths and 140 hospital admissions or emergency room visits. These impacts, along with other adverse health impacts such as asthma episodes, have been estimated to cost our society $800 million in a single year.26
While natural gas plants will eliminate almost entirely emissions of SO2, mercury, and other toxics, they will not eliminate nitrogen oxides (NOx) emissions. NOx emissions from natural gas-fired power plants (0.2-0.7 kg/MWh) are, on average, 60-80% lower than NOx emissions from coal plants (i.e. 2 kg/MWh).27 The NOx emissions emitted from a gas-fired power plant, however, could still place a substantial load on an airshed that is already heavily impacted by vehicular or industrial emissions. With non-emitting renewable energies such as solar, water or wind power, no air pollutants are released by the generation of electricity.
Renewable energy reduces mercury emissions
The elimination of coal-fired power plants across Canada can produce health benefits by eliminating a significant source of mercury pollution. In the early 2000s, coal-fired power plants were responsible for approximately 18% of the mercury emissions in Canada. Mercury is a persistent toxic substance that accumulates in the aquatic food chain. Prenatal and early-life exposure to mercury (resulting from the consumption of mercury-contaminated fish) is linked to adverse developmental impacts such as reductions in cognitive abilities and motor skills. Women of childbearing age, pregnant women, young children, and populations that depend on fish as a traditional food source, are at greatest risk from mercury.28
Researchers in the US have estimated that the lifelong losses in IQ and productivity resulting from prenatal exposure to mercury emitted from US coal plants is $1.3 billion annually.29 By phasing out coal-fired power plants, Canada can eliminate this source of mercury emissions, reduce the accumulation of mercury in the aquatic food chain, and reduce its future impacts on human health. With renewable energies, no mercury or other toxics are released into the air or water during the generation of electricity.
Coal- and natural gas-fired power plants both fuel climate change
In order to preserve the habitability of the planet, the Intergovernmental Panel on Climate Change (IPCC) has concluded that all countries must reduce climate emissions by 45% by 2030 and to net zero by 2050.30
Coal-fired power plants are among the world’s most carbon-intensive forms of electricity generation.31 One MWh of electricity generated from coal emits 1,070 kg of carbon dioxide (CO2). By accelerating the phase-out of Canada’s coal plants to 2030, it is estimated that Canada could cut its total GHG emissions by 8.5% by 2030.32
Natural gas, which is composed almost entirely of methane, was once viewed as a bridge fuel to a low-carbon future. While natural gas-fired power plants release significantly fewer GHGs than coal-fired power plants, they still release between 360 to 500 kg of CO2 per MWh of electricity generated.33 In addition, a number of studies have demonstrated that significant quantities of methane can be released as leaks or intentional emissions during the extraction process.34 Current estimates suggest that the oil and gas sector is responsible for 44% of methane emissions in Canada (approximately 15% of Canada’s GHGs).35 Estimates of methane emissions vary considerably. New research suggests that total methane emissions from Canada’s oil and gas sector is 25-50% greater than previously estimated.36 Methane emissions are a concern because methane’s global warming potential is 86 times that of carbon dioxide over a 20-year period.37
Since 2007, global methane emissions have been rising.38 Evidence indicates that hydraulic fracturing (also known as “fracking”) for oil and natural gas in North America is contributing to this increase.39 By discouraging increased reliance on natural gas-fired power plants, and accelerating their phase-out, we can avoid the GHG emissions associated with the extraction of natural gas as well as the emissions associated with their operation.
Climate change is already harming people in Canada
On a global scale, climate change is already having a catastrophic impact on human health. In 2018, nearly 300,000 people around the world died prematurely because of hotter temperatures resulting from global warming.40 And yet, increasing temperatures is only one of the many risk factors presented by climate change.
In different parts of Canada, climate change has contributed to an increase in the frequency and intensity of floods, wildfires, hurricanes, ice storms and heat waves, over the last several decades.41 These events have exposed millions to extremely high levels of toxic air pollution,42 forced hundreds of thousands of Canadians to evacuate their homes, and left hundreds of thousands without power for extended periods. Climate change is also melting permafrost in the far north, increasing sea levels on three coast lines, and extending the range of vector-borne diseases such as Lyme disease.43
While climate change can harm the health of everyone, it has a greater impact on some. Young children, older people, and people with pre-existing health conditions are more sensitive to heat waves and wildfire smoke. Indigenous Peoples in northern communities can experience increased food insecurity as melting permafrost and changing plant and animal populations disrupt their access to traditional foods. In addition, people who live on lower incomes may not have the resources to protect themselves or recover from extreme weather events such as heat waves, floods and wildfires.44
The costs of weather-related disasters fuelled by global warming are considerable. The number of catastrophic events in Canada has more than tripled since the 1980s. Over the last nine years, these events have resulted in $14 billion in insurance costs in Canada, an increase of 1,250% since the 1970s.45
Extraction of natural gas harms health
The transition from natural gas to renewable energy would also eliminate health concerns associated with the extraction of natural gas. Much of the natural gas used in Canada is extracted through hydraulic fracturing. Studies of populations living near hydraulic fracturing operations in the US have identified over 30 different negative health outcomes, including adverse birth outcomes, birth defects, childhood cancer, and respiratory illnesses. The strongest evidence is for adverse impacts on pregnancy, birth outcomes, birth defects and asthma exacerbations. A few studies have also looked at the potential impact of fracking on cancer incidence. While the results are mixed, there is evidence that suggests that fracking may increase the risk of childhood acute lymphocytic leukemia among children whose mothers live in close proximity to oil and gas wells during pregnancy.46
Investing in a healthy, green and just recovery
In the updated climate action plan for Canada released in December 2020, the federal government promised to:
- Invest nearly $1 billion over four years to increase renewable energy capacity, modernize electricity grids with technologies such as power storage, and help transition our economy from fossil fuels to electricity;
- Invest $300 million over five years to replace diesel-generated electricity in rural, remote and Indigenous communities with clean, reliable energy by 2030; and
- Work with provinces and territories to link electricity grids with support from the Canada Infrastructure Bank, which has committed $2.5 billion for clean power projects over the next 3 years and $5 billion for clean energy over the long-term.47
These are essential investments that will prepare our country for a healthier and more sustainable future.
The Building Back Better report48 estimates that the federal government could create almost one million cumulative jobs, virtually eliminate 75 Mt of GHG emissions from the electricity sector, and improve public health by investing $6.7 billion over a 10-year period in the creation of a carbon-free and resilient electricity grid across the country that involves:
- developing transmission infrastructure between provinces;
- building up intra-provincial transmission capacity to ensure access to wholesale markets, build investor confidence, and attract investments in renewable energy, especially in the rich solar and wind regions of southern Alberta and Saskatchewan; and
- supporting the rapid deployment of energy storage, particularly in provinces that do not have access to sufficient electricity reservoir storage.
This public investment could foster $95 billion in private investments to the development of 22,000 MW of wind capacity and 25,000 MW of solar capacity. When totally built out, it is estimated that Canada would have an annual capacity of 68 million MWh of wind power and 31 million MWh of solar power. When combined with the current and committed carbon-free electricity supply, it would bring Canada’s total annual supply of carbon-free electricity to 642 million MWh; 67 million MWh more than we consume today.48
Raise your voice to support greater investments and a faster transition to renewable energies to create healthy, green and just communities.
Prepared by
Kim Perrotta, MHSc,
Executive Director, CHASE
with input from
Ronald Macfarlane, MLS, MSc,
Helen Doyle, BSc, OPHA Board Member and
Carol Mee, BScN, MEd
REFERENCES
- EnergyRates.ca. 2020. Residential Electricity and Natural Gas Plans.
- Canada Energy Regulator. 2020. Provincial and Territorial Energy Profiles – Canada
- Government of Canada. 2017. What is Renewable Energy?
- Klein Manfred. (n.d.) Gas Turbine Systems as a Cleaner Energy Choice. Prepared for Energy and Environment Gas Turbine Laboratory | Institute for Aerospace Research National Research Council.
- Ontario Clean Air Alliance. 2020. Phasing-Out Ontario’s Gas-Fired Power Plants: A Road Map.
- Government of Canada. 2021. Greenhouse Gas Emissions and Sinks: Executive Summary.
- Canada. 2020. Coal Phase-out: The Powering Past Coal Alliance.
- Canada Energy Regulator. 2020. Provincial and Territorial Energy Profiles – Alberta
- Canada Energy Regulator. 2020. Provincial and Territorial Energy Profiles – Saskatchewan
- Canada Energy Regulator. 2020. Provincial and Territorial Energy Profiles – Nova Scotia
- Canada Energy Regulator. 2020. Provincial and Territorial Energy Profiles – New Brunswick
- Canada Energy Regulator. 2020. Provincial and Territorial Energy Profiles - Ontario
- Ontario Clean Air Alliance. 2020. Phasing-Out Ontario’s Gas-Fired Power Plants: A Road Map.
- Canada Energy Regulator. 2020. Provincial and Territorial Energy Profiles – Canada
- Gorski J and Jeyakumar B. 2019. Reliable, affordable: The economic case for scaling up clean energy portfolios: A study comparing clean energy portfolios and natural gas for electricity generation. The Pembina Institute.
- Gorski J and Jeyakumar B. 2019. Reliable, affordable: The economic case for scaling up clean energy portfolios: A study comparing clean energy portfolios and natural gas for electricity generation. The Pembina Institute.
- Lazard. 2020. Levelized Cost of Energy and Levelized Cost of Storage – 2020. Lazard.com _ Levelized Cost of Energy and Levelized Cost of Storage – 2020.pdf
- Health Canada. 2019. Health Impacts of Air Pollution in Canada – Estimates of Morbidity and Premature Mortality Outcomes – 2019 Report.
- World Health Organization. 2013. Review of evidence on health aspects of air pollution – REVIHAAP Project.
- Health Canada. 2016. Human Health Risk Assessment for Sulphur Dioxide.
- World Health Organization. 2013. Review of evidence on health aspects of air pollution – REVIHAAP Project.
- Wu X, Nethery RC, Sabath MB, Braun D, Dominici F. 2020. Exposure to air pollution and COVID-19 mortality in the United States. MedRxiv.
- Pozzer et al. 2020. Regional and global contributions of air pollution to risk of death from COVID-19. Regional Society of European Cardiology. Oct.
- Government of Canada. 2020. Health Effects of Air Pollution. Webpage. October.
- Public Health Agency of Canada, Pan-Canadian Public Health Network, Statistics Canada, and the Canadian Institute of for Health Information. 2018. Key Health Inequalities in Canada report/Pan-Canadian Health Inequalities Data Tool.
- Israel B and Flanagan E. 2016. Out with the Coal, in with the New: National benefits of an accelerated phase-out of coal-fired power. Pembina Institute
- Klein, Manfred. 2018 as cited in the Submission by CAPE and other health organizations to the Federal Government re: February 17, 2018 Regulations Limiting Carbon Dioxide Emissions from Natural Gas-fired Generation of Electricity. Statutory authority Canadian Environmental Protection Act, 1999
- Canada-Wide Standards for Mercury Emissions from Coal-Fired Electric Power Generation Plants.
- Trasande L, Landrigan PJ & Schecter C. 2005. Public health and economic consequences of methyl mercury to the developing brain. Environmental Health Perspectives; 113(5): 590–596.
- Intergovernmental Panel on Climate Change (IPCC). 2018. Summary for Policymakers. IPCC Special Report on Global Warming of 1.5°C approved by governments.
- Intergovernmental Panel on Climate Change (IPCC). 2014. IPCC Working Group III – Mitigation of Climate Change, Annex III: Technology - specific cost & performance parameters.
- Israel B and Flanagan E. 2016. Out with the Coal, in with the New: National benefits of an accelerated phase-out of coal-fired power. Pembina Institute
- Klein, Manfred. 2018 as cited in the Submission by CAPE and other health organizations to the Federal Government re: February 17, 2018 Regulations Limiting Carbon Dioxide Emissions from Natural Gas-fired Generation of Electricity. Statutory authority Canadian Environmental Protection Act, 1999
- Alvarez R et al., 2018 & Atherton E et al., 2017 & Miller S et al., 2013 as cited by Macfarlane R and Perrotta K. 2020. Fractures in the Bridge – Unconventional (Fracked) Natural Gas, Climate Change and Human Health. Canadian Association of Physicians for the Environment (CAPE).
- Canada, 2016. Canada’s mid-century Long-Term Low-Greenhouse Gas Development Strategy.
- Johnson M et al. 2017. Comparisons of Airborne Measurements and Inventory Estimates of Methane Emissions in the Alberta Upstream Oil and Gas Sector. Environmental Science and Technology. 51 (21), pp 13008–13017. Oct 17
- Intergovernmental Panel on Climate Change (IPCC). 2013. IPCC, 2013: Climate Change 2013: The Physical Science Basis. Contribution of Working Group I to the Fifth Assessment Report of the Intergovernmental Panel on Climate Change, Ch.8, p. 711-714, Table 8.7
- Nisbet, EG et al. 2019. Very strong atmospheric methane growth in the 4 years 2014–2017: Implications for the Paris Agreement. Global Biogeochemical Cycles 33.3 (2019): 318-342.
- Howarth RW. 2019 as cited by Macfarlane R and Perrotta K. 2020. Fractures in the Bridge – Unconventional (Fracked) Natural Gas, Climate Change and Human Health. Canadian Association of Physicians for the Environment (CAPE).
- Watts Nick et al. 2020. The 2020 report of The Lancet Countdown on health and climate change: responding to converging crises. Review. The Lancet.
- Bush, E. and Lemmen, D.S., editors (2019): Canada’s Changing Climate Report; Government of Canada, Ottawa, ON. 444 p
- Schmunk Rhianna. 2020. Smoked in: A look back at B.C.’s haziest wildfire seasons over the past 20 years. CBC News. September 19
- Doyle Helen Marie. 2019. Module 3: Climate Change Health Impacts Aacross Canada. Climate Change Toolkit for Health Professionals. Editor: Perrotta Kim Perrotta. Canadian Association of Physicians for the Environment (CAPE). 240 pages
- Berry P, Clarke K, Fleury MD & Parker S. 2014. Human Health in Canada in a Changing Climate: Sector Perspectives on Impacts and Adaptation. Editors: Warren FJ and Lemmen DS. Government of Canada, Ottawa, Ontario.
- Canadian Institute for Climate Choices. 2020. The Tip of the Iceberg: Navigating the Known and Unknown Costs of Climate Change for Canada,
- Macfarlane R and Perrotta K. 2020. Fractures in the Bridge – Unconventional (Fracked) Natural Gas, Climate Change and Human Health. Canadian Association of Physicians for the Environment (CAPE).
- Environment and Climate Change Canada. 2020. A Healthy Environment and a Healthy Economy. Canada’s strengthened climate plan to create jobs and support people, communities and the planet. December.
- Torrie R, Bak C, Heaps T. 2020. Built OutBuilding Back Better. Synthesis Report.
Last modified: March 24, 2021